
How to see Instagram insights and read the numbers
If you want to know how to see Instagram insights, open the Dashboard on your profile and choose Insights: you get data on views, watch time and new followers for any period within the last 90 days. You need a public personal or professional account. This guide is for creators, experts and small businesses: where to find insights, what the numbers mean and how to compare your Reels.
Where to find insights on Instagram
You open Instagram insights from your account Dashboard: the path is almost the same in the app and on the web, and you pick a preset period or set your own. The main condition from the Instagram Help Center on account and content insights is a public account.
- Open the Dashboard. On instagram.com, select Dashboard in the left-hand menu; in the app, go to your profile and tap the dashboard under your bio.
- Go to Insights. On a professional account, select Insights under For professionals; on a personal account, select Your dashboard under Your insights and tools.
- Pick the type of data. Account shows the overall picture, Content shows individual posts.
- Set the period. Presets are 7, 14, 30 or 90 days, and a custom range can be any dates within the past 90 days.
If you made your account public recently, you may not see past insights. Switching to a private account removes access to insights, but you get the past data back if you go public again within 90 days. The button below gives you 14 days of Pro free; the AI analysis itself spends credits.
What the numbers in Instagram insights mean
Instagram insights have two groups of numbers: account totals for a period and metrics for each post. Most wrong conclusions come from mixing up views and viewers.
| Metric | What it means | What it tells you |
|---|---|---|
| Views | how many times the reel started to play, including replays | overall interest in the reel |
| Viewers | how many unique accounts saw the reel on screen at least once | real reach in people |
| Watch time | total time the reel was played, including replays | how well the reel holds attention |
| Average watch time | watch time divided by the number of initial views | whether people reached the main point |
| Follows | how many accounts followed you after watching the reel | whether the reel brings new people |
The definitions come from the Instagram Help Center on reels insights. Instagram notes that some metrics are estimated and still in development, so compare trends rather than single numbers.
Audience demographics appear only when you reach or engage more than 100 viewers and pick a preset period. If there is no data for 7 days, try 30 or 90 days.
Instagram Reels insights: what to check on every reel
Reels insights open from the reel itself: the Reels tab on your profile, the reel you need, then View insights. They are available for reels posted on or after May 14, 2021, and stay available for 2 years after publishing.
Check 3 numbers together on every reel:
- Viewers, not just views: 10,000 views from 3,000 viewers mean people rewatch the reel.
- Average watch time against the reel length: if the reel runs 30 seconds and the average is 6 seconds, the hook doesn’t hold.
- Follows per 1,000 viewers: this number shows whether the reel sells your profile.
Example: two reels each got 20,000 views. The first brought 12 follows, the second 140. Repeat the structure of the second one, even if it has fewer likes. How to break a strong reel down into hook and structure is covered in our guide to auditing Instagram content and predicting viral posts.
How to work out engagement rate and compare reels
Engagement rate, or ER, is the sum of interactions divided by reach, multiplied by 100: interactions are likes, comments, saves and shares, and reach is the reel’s viewers. Instagram doesn’t show ER itself, but every part of the formula is in the post insights.
| Reel | Likes | Comments | Saves | Shares | Viewers | ER |
|---|---|---|---|---|---|---|
| A | 420 | 35 | 60 | 25 | 9,000 | 6.0% |
| B | 180 | 12 | 140 | 68 | 5,000 | 8.0% |
In this example reel A has more likes, while reel B has higher engagement and gets saved and shared more often. Saves and shares usually say more about a reel’s usefulness than likes do.
Compare reels of the same format and period: a how-to reel and an entertaining trend give different numbers. The easiest way is a table of your last 10 to 20 reels where you mark the topics and hooks above your median. Ideas those numbers point to fit well into a plan built with predictive content analytics.
What counts as a good number
There is no single benchmark for Instagram insights: reach and engagement depend on the niche, format and account size, and Instagram doesn’t publish averages. An honest benchmark is your own 30-day median plus a comparison with similar accounts in your niche.
Your median is simple to find: write down the viewers of your last 10 reels, sort them and take the middle value. A reel at 2 times your median or more is a winner, and one at half your median is a reason to rework the hook and the cover. Hook formulas to test are collected in our list of 300 hooks for your videos.
A niche comparison beats any internet average. Virale keeps a base of 280+ niches with percentiles for views and engagement, and only niches with at least 20 videos make it into the benchmark. Example: a 3% ER can be strong for a business account with a broad audience and weak for a narrow expert blog.
Why reach drops and how to check it in insights
Reach drops for one of several reasons, and insights help you tell a real decline from a metric change or a single weak reel. Start with checks, not with theories about shadowbans.
- Compare equal periods. A week with a holiday and a regular week give different pictures.
- Look at viewers, not views. If views fell but viewers stayed the same, people rewatch your reels less often.
- Check average watch time. If it dropped, the problem is in the hook or the reel length.
- Count your posting frequency. A 2-week break almost always lowers the reach of the next reels.
Example: an expert posted 4 reels a week, then 1, and saw reach fall a month later. Insights showed that average watch time stayed the same, so reel quality held up and the cause was frequency. What to do next with a drop is covered in our guide on why Reels suddenly stop getting views.
How to analyze your account insights with AI
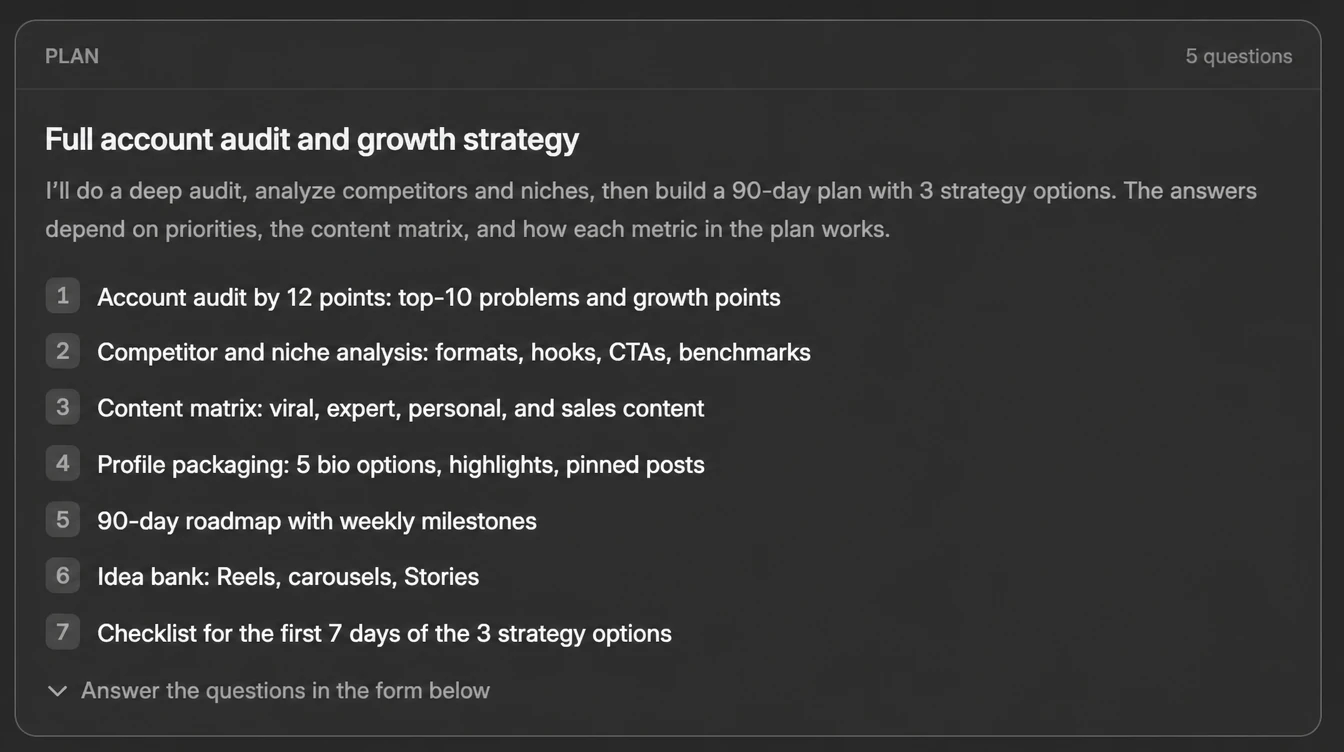
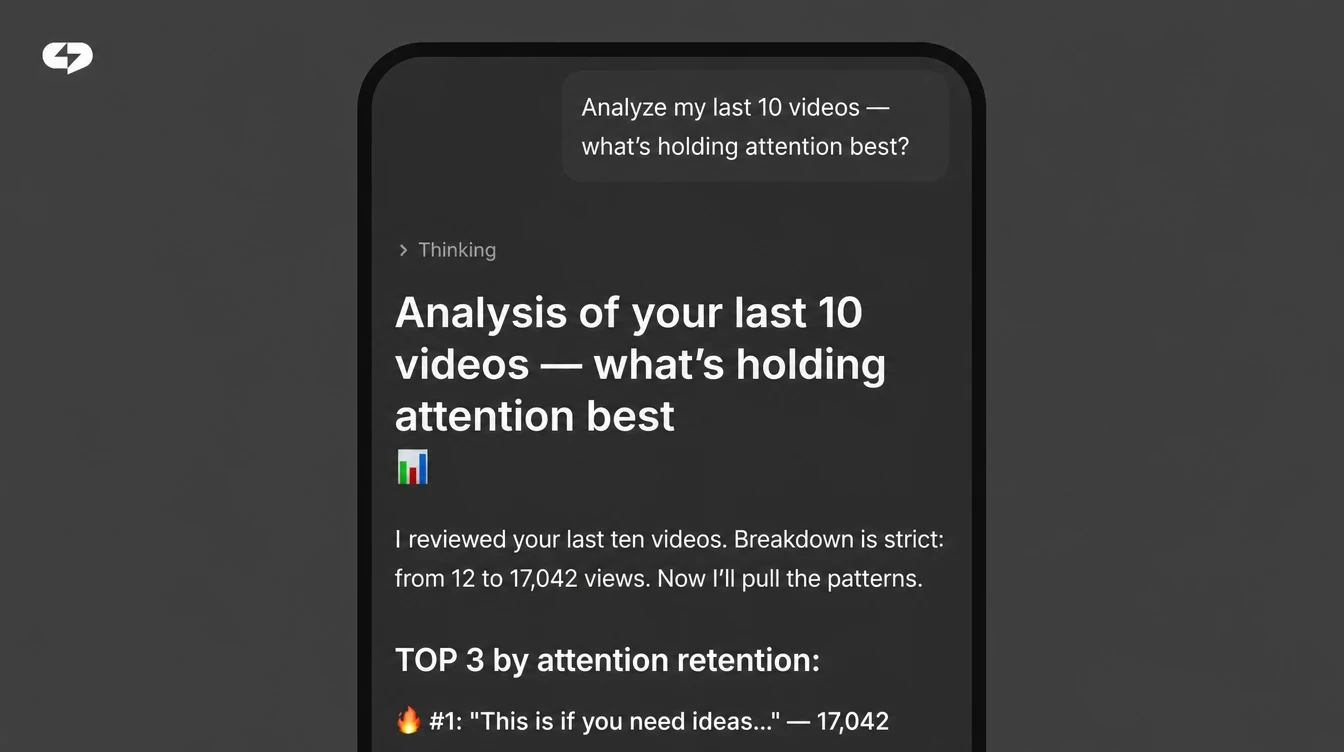
You can analyze your account insights in the AI creator chat in Virale: the agent looks at up to 100 recent posts, counts views and engagement, compares the account with its niche and suggests what to do next. You write the request in plain words, for example “analyze my account and tell me which reels are above my median”.
- What you need: an Instagram or TikTok account connected to Virale.
- What you get: strong and weak reels, popular formats and hooks, recommendations for the next posts.
- Limits: one account can be analyzed again no more than once an hour, and each run spends AI credits.
The separate analytics dashboard in Virale is currently open only to beta testers, so the chat is the main route for everyone. Analysis works on plans with credits; how many credits Creator includes is on the pricing page. Example: a creator asks to compare the last 15 reels and gets a list of 3 topics that stay above the median and 2 formats worth keeping.
Key takeaways
- Instagram insights are available on a public account for the last 90 days, and reels insights for 2 years after publishing.
- Read viewers, average watch time and follows together: views alone mislead.
- Treat your 30-day median and a niche comparison as the benchmark, not internet averages.
- Next step: write down the viewers of your last 10 reels, find the median and break down 2 reels above it.
FAQ
How do I see Instagram insights on my phone?
In the app, insights open from your profile: tap the dashboard under your bio and select Insights on a professional account or Your dashboard on a personal one. Then choose Account for the overall picture or Content for individual posts. The period is set in the date menu: presets of 7, 14, 30 or 90 days, or a custom range in the calendar within the past 90 days. Insights for a single reel open faster: go to the Reels tab on your profile, pick the video and tap View insights. For example, to compare your last two reels, open the insights of each and write down viewers, average watch time and follows, and the difference shows right away. The account has to be public. If you made it public recently, past data may be missing, which is how Instagram’s rule works. On a computer, the same report opens through Dashboard in the left-hand menu on instagram.com.
Why can’t I see insights on Instagram?
You most often can’t see insights because the account is private: according to the Instagram Help Center, only a public personal or professional account can view insights. If you switched your account to private, you lose access to insights. You can get it back together with past data if you make the account public again within 90 days. The second reason is that the account went public recently, so there is no data for earlier periods yet. The third concerns demographics: they appear only when you reach more than 100 viewers, and only with a preset period. For example, a creator with 300 followers doesn’t see audience age and cities for 7 days but sees them for 30 or 90 days, once enough viewers add up. Reels insights exist for reels posted on or after May 14, 2021. If nothing helps, update the app or open insights on instagram.com through Dashboard.
What does ‘viewers’ mean in Instagram insights?
Viewers in Instagram insights are the number of unique accounts that saw your reel on screen at least once, even if they didn’t watch it to the end. Views count every time the reel starts, including replays, so there are almost always more views than viewers. The ratio between the two says a lot. If views are 2 to 3 times higher than viewers, people rewatch the reel, which is a good sign. If the numbers are nearly equal, people watch it once. For example, a reel with 15,000 views and 6,000 viewers was played 2.5 times per viewer on average. Reels like that are worth studying and repeating by structure. Instagram notes that Viewers is estimated and still in development, so compare it across your own reels, not with other accounts. A reel with 5,000 viewers and 300 follows is stronger than one with 20,000 viewers and 40 follows.
Can I see insights for someone else’s Instagram account?
You can’t see another account’s insights in Instagram: they are visible only to the account owner. From the outside you see public numbers: followers, likes, comments and the view counter on reels. That is enough for a rough estimate, such as comparing a creator’s reel views with their follower count. You can go deeper in the AI creator chat: send a profile link and ask the agent to analyze the best reels, hooks and formats. Adding an account by link costs 20 credits, charged only if an analysis actually runs for it. For example, you pick 3 competitor accounts and ask for a table of hooks from their most-viewed reels to see which topics work in your niche. Internal metrics such as average watch time or follows after a reel can’t be seen for someone else’s account. The breakdown works on plans with credits, and you can start the trial after you sign up for ChatPlace.
How long does Instagram keep insights?
Overall account and content insights are available for any period within the past 90 days, while insights for an individual reel stay available for 2 years after publishing. This means you can’t compare months from half a year ago in the overall report. That is why it helps to copy key numbers into your own table once a month: viewers, engagement, follows and the number of posts. After six months you have your own account history, which Instagram doesn’t keep in the overall report. For example, an expert copies the median viewers and follows for the past 30 days into a table on the first day of each month and sees how the account changes after new content series. Reels insights exist for reels posted on or after May 14, 2021. The report period can be a preset of 7, 14, 30 or 90 days or a custom range in the calendar, also within the past 90 days.
What is a good engagement rate on Instagram?
A good engagement rate on Instagram is one above your own median and above the median of similar accounts in your niche, not a universal number from the internet. Instagram doesn’t publish average engagement figures. The numbers also depend heavily on the niche, format and account size. ER is calculated like this: add up likes, comments, saves and shares, divide by the reel’s viewers and multiply by 100. For example, a reel with 300 likes, 20 comments, 50 saves and 30 shares from 8,000 viewers has an ER of 5%. If the median of your last 10 reels is 3%, that reel is a winner. Compare reels of the same format, because entertaining trends and how-to reels engage differently. Calculate ER on viewers, not followers, so the number stays fair for reels that reached recommendations. For a niche comparison, ask the agent in the Virale chat to analyze your account against its base of 280+ niches.
How do I check reach on Instagram?
You check reach on Instagram in your account insights: open the Dashboard, select Insights, then Account and the period you need. There you see how many accounts saw your content over 7, 14, 30 or 90 days. For an individual reel, reach is the Viewers metric in reels insights: the number of unique accounts that saw the reel at least once. It helps to compare reach with your follower count. If your reels regularly reach more people than you have followers, your content goes beyond your audience and brings in new people. For example, an account with 2,000 followers whose recent reels get 8,000 viewers each gets most of its reach from recommendations. Watch follows after reels too: reach without follows means people like the topic but not the profile yet. The numbers are estimated, so compare week with week and month with month, not single days. Story reach is checked separately, in the insights of each story.
How often should I check Instagram insights?
Checking Instagram insights once a week works for quick conclusions, and once a month for the overall picture. Daily checks tend to confuse more than help: reels keep collecting views for several days, so yesterday’s numbers aren’t final. Once a week, write down viewers, average watch time and follows for each new reel. Once a month, work out your median viewers, average ER and number of posts and compare them with the previous month. For example, a social media manager fills in a table for last week’s reels every Monday in 15 minutes and sends the client a short report with 3 takeaways at the start of each month. Overall insights are kept for only 90 days, so monthly records in your own table are the only way to compare the account over a long period. A breakdown in the Virale chat can run no more than once an hour per account, and once a week is usually enough.

Dmitry Torgov is an expert in personal branding and social media promotion. Co-founder of ChatPlace.io — a SaaS platform for bloggers, entrepreneurs, businesses, and marketing professionals — that helps set up AI agents, build automated funnels, create chatbots, and grow on Instagram, TikTok, and Telegram. Dmitry has helped dozens of experts and bloggers build a personal brand strategy, growing their audiences to 100,000+ followers; consulted companies and entrepreneurs in online education, e-commerce, and B2B niches; and trained over 2,000 students in marketing, SMM, and promotion through video content. “Personal branding is not about views, likes, or quick hype. Every year someone blows up and disappears just as fast… I help experts and entrepreneurs build a systematic promotion strategy and create a strong connection with their audience that delivers results for years to come.”